

- Extent of the 2009-10 Rivers LiDAR survey: 127,000 linear kilometres.
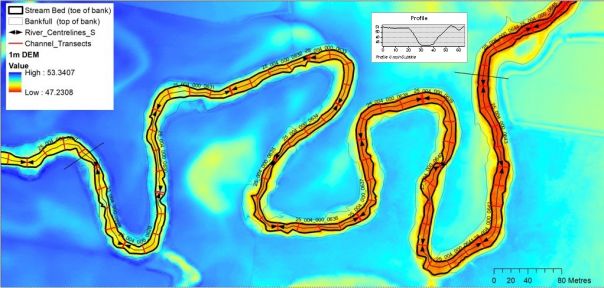
- River centreline and river bank delineation.

- 1 M Digital Elevation Model (DEM) and 4 ppms LiDAR.

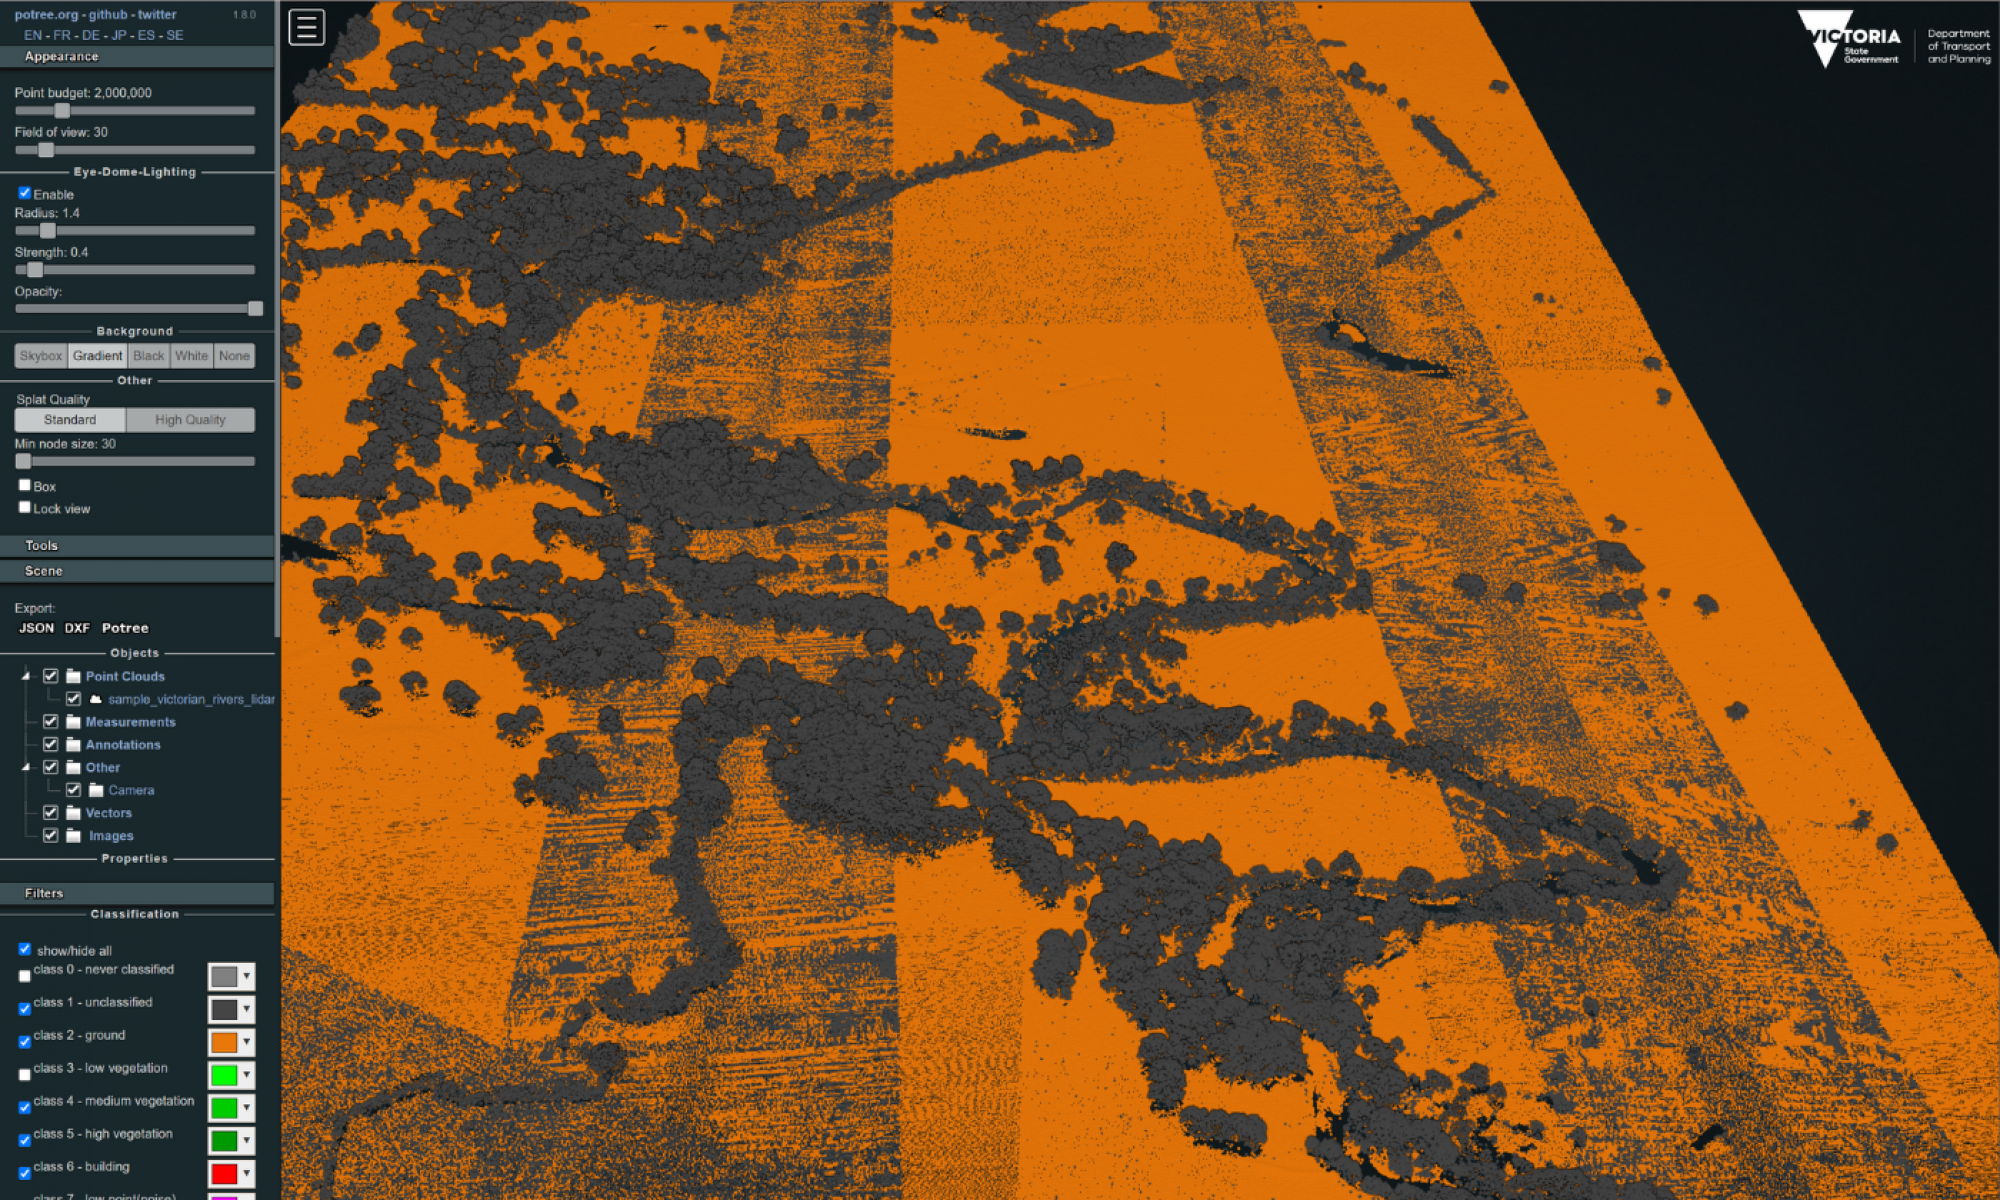
- 3D Digital Elevation Model (DEM) with LiDAR point-cloud.
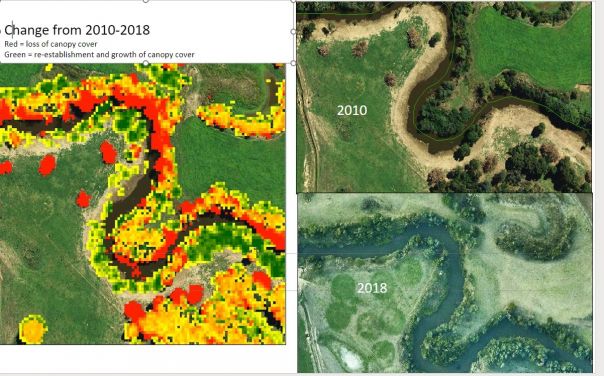
- 2010 baseline data supporting change analysis.
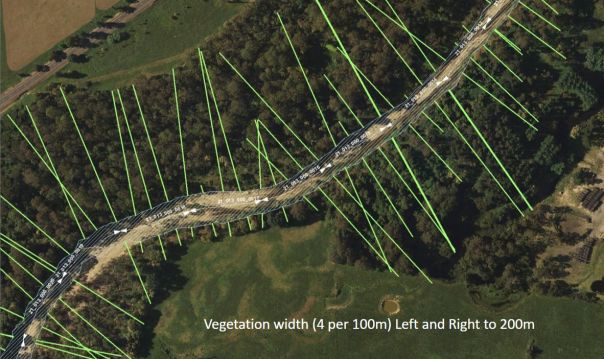
- Riparian vegetation monitoring - vegetation width.
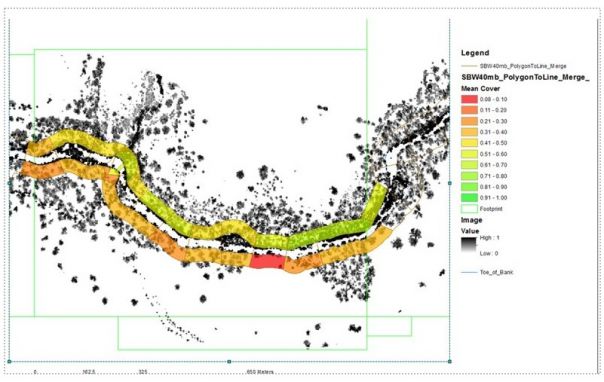
- Riparian vegetation monitoring - vegetation structure.
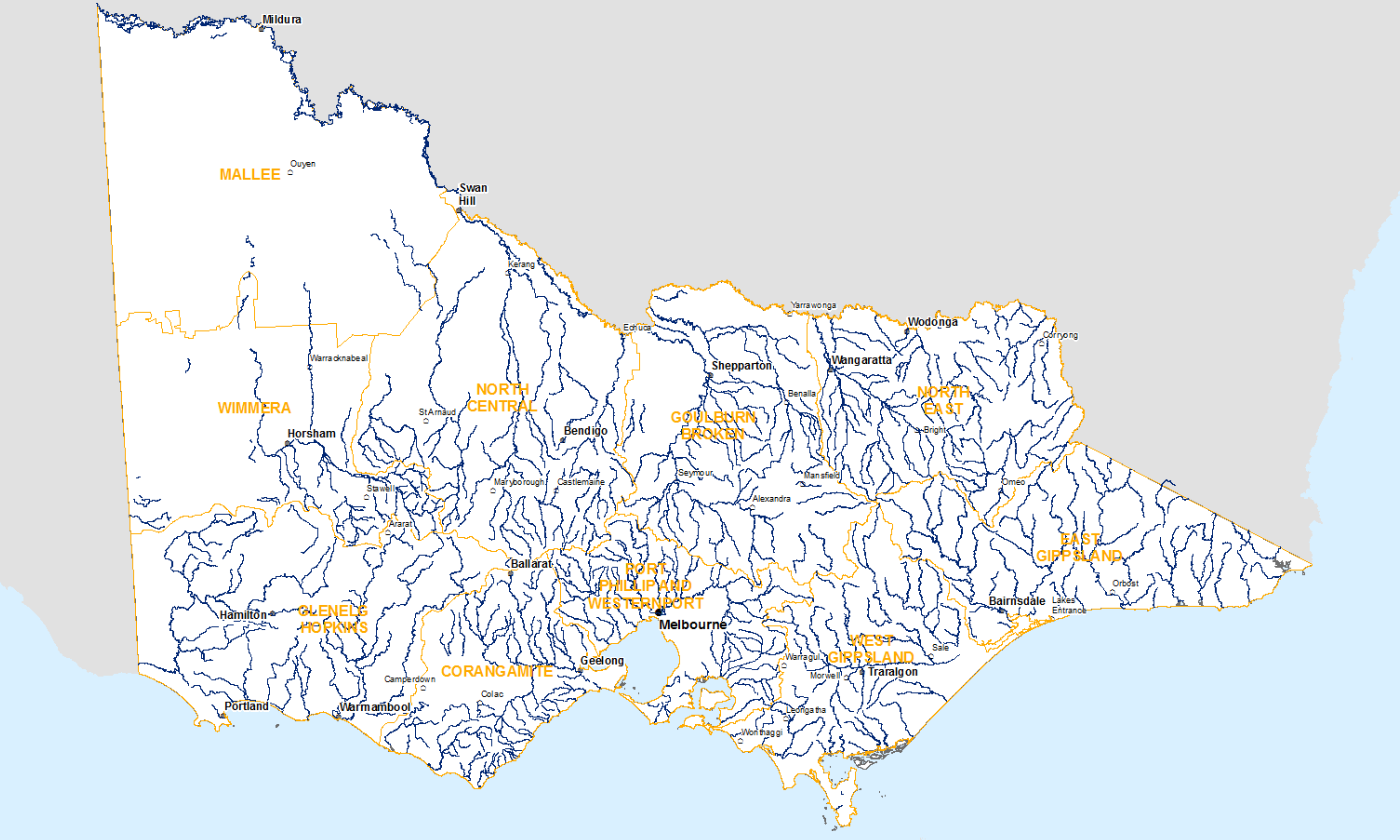
Extent of the 2009-10 Rivers LiDAR survey: 127,000 linear kilometres.

River centreline and river bank delineation.
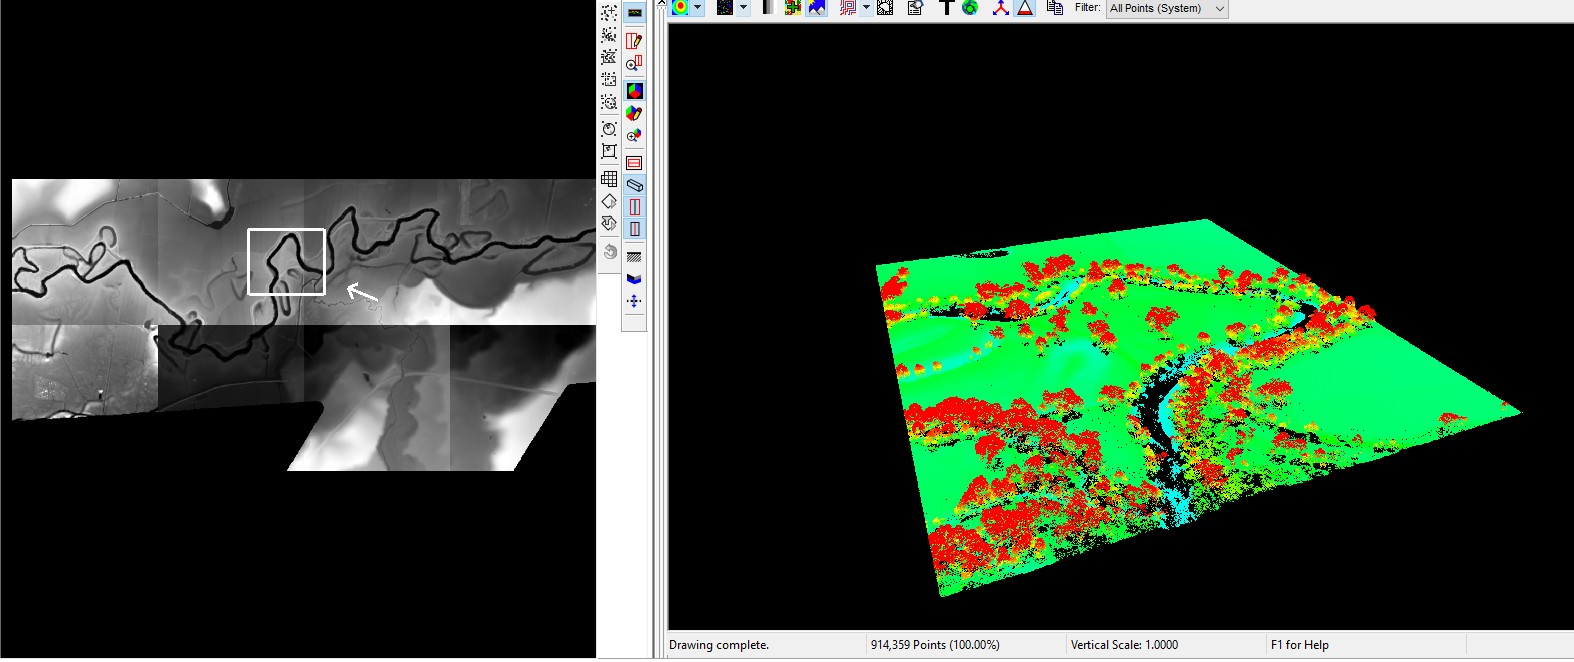
1 M Digital Elevation Model (DEM) and 4 ppms LiDAR.
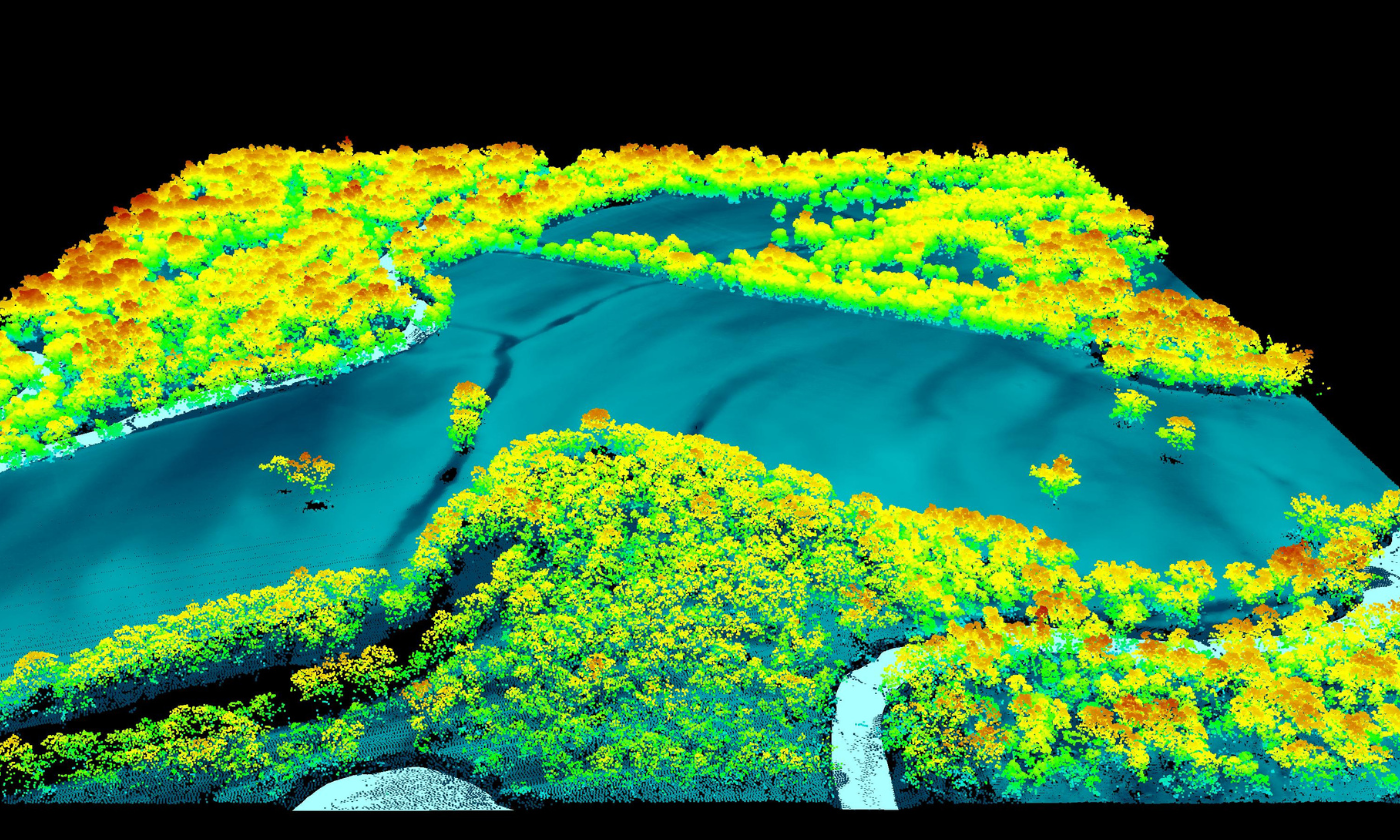
3D Digital Elevation Model (DEM) with LiDAR point-cloud.
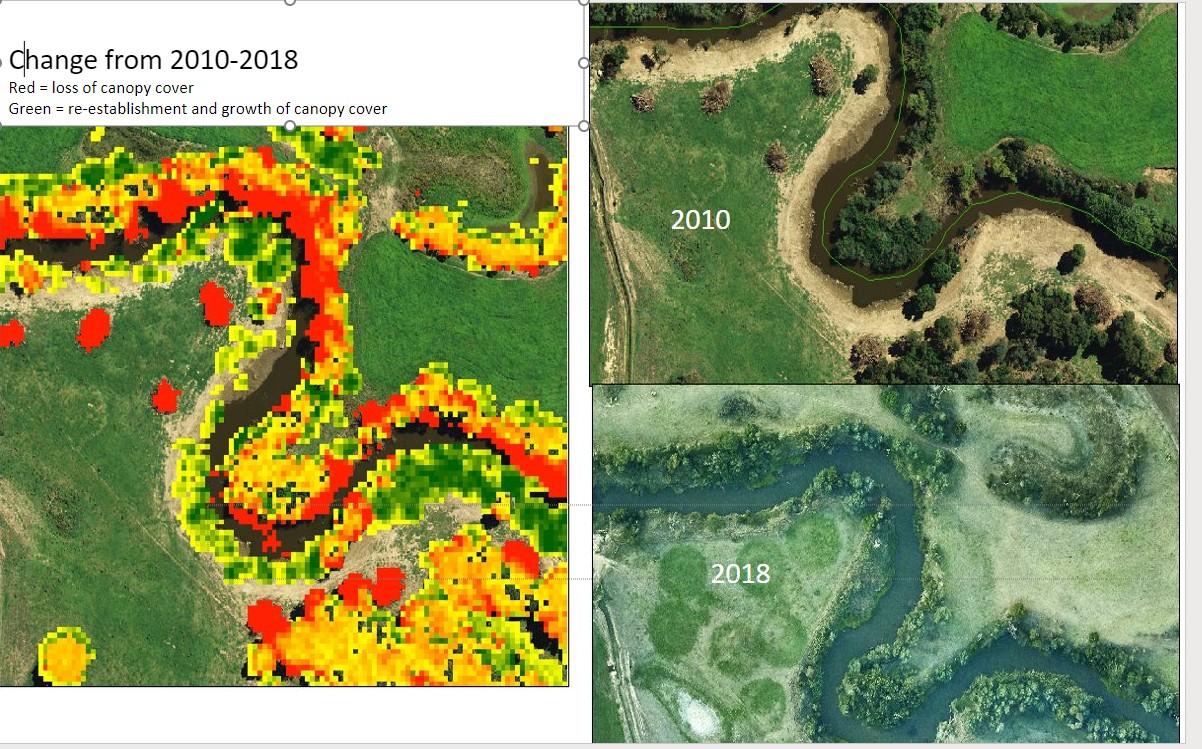
2010 baseline data supporting change analysis.
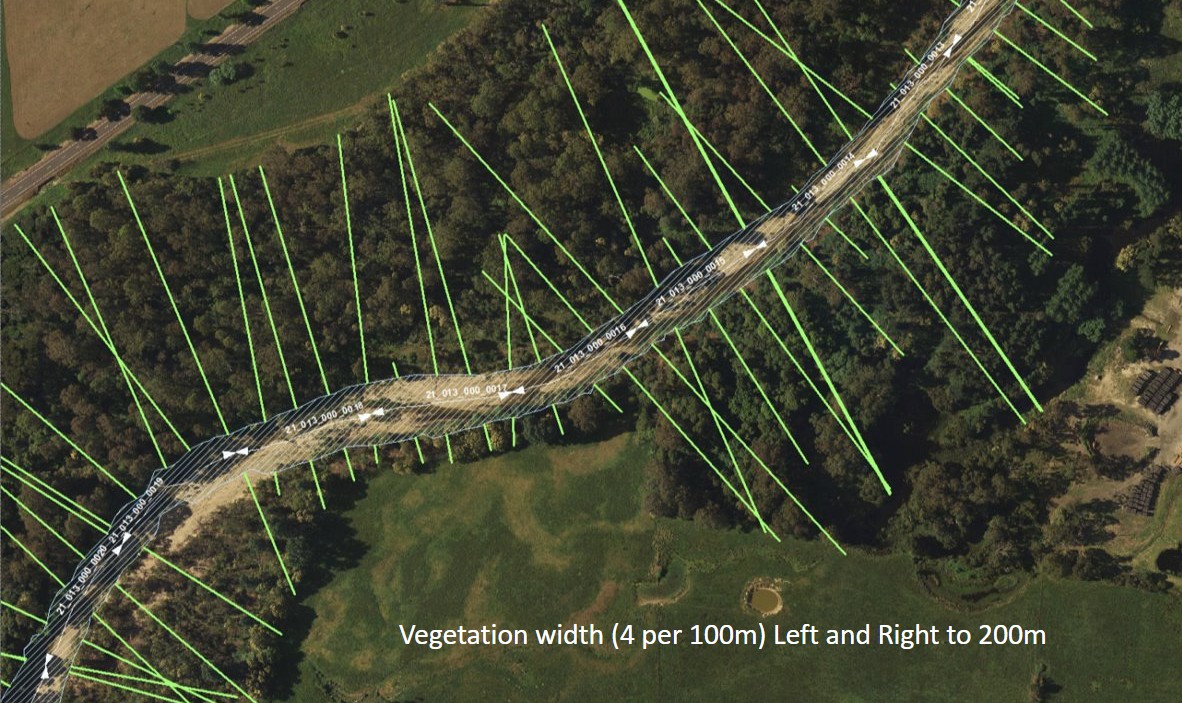
Riparian vegetation monitoring - vegetation width.

Riparian vegetation monitoring - vegetation structure.
The Victorian Rivers LiDAR was a flagship project to create baseline river condition data for ongoing river monitoring. LiDAR data was used to generate accurate Digital Elevation Model (DEM) surface representations of river channel form and riparian vegetation attributes for rivers across Victoria totalling over 127,000 linear kilometres in survey length.
Since this project, many subsequent river LiDAR surveys have been conducted, enabling change metrics to be mapped with this evidence-based knowledge. This has ultimately informed how these rivers continue to be managed.
Extent: 127,000 linear kilometres
Point density: 4 pts/m2 (first returns)
Coordinate reference system: GDA94, MGA54 and MGA55, AHD
Elevation products: LAS 1.2, DEM 1 m, CHM 1 m
Vertical accuracy: 20 cm
Availability: These products are available to license through Vicmap’s Value Added Reseller (VAR) and Data Service Provider (DSP) network for the private sector and via coordinated.imagery@transport.vic.gov.au for government entities.
Partner agencies: Department of Environment, Energy and Climate Action (DEECA), Catchment Management Authorities and Coordinated Imagery Program (CIP), Department of Transport and Planning (DTP).
Page last updated: 25/02/25