
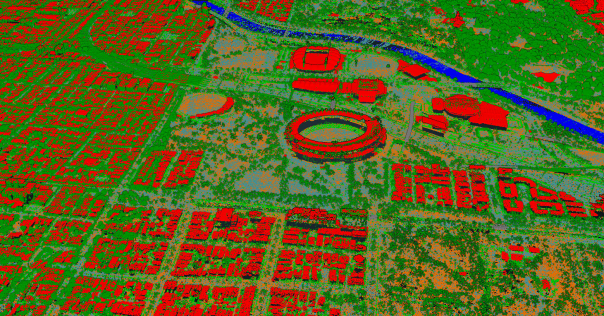
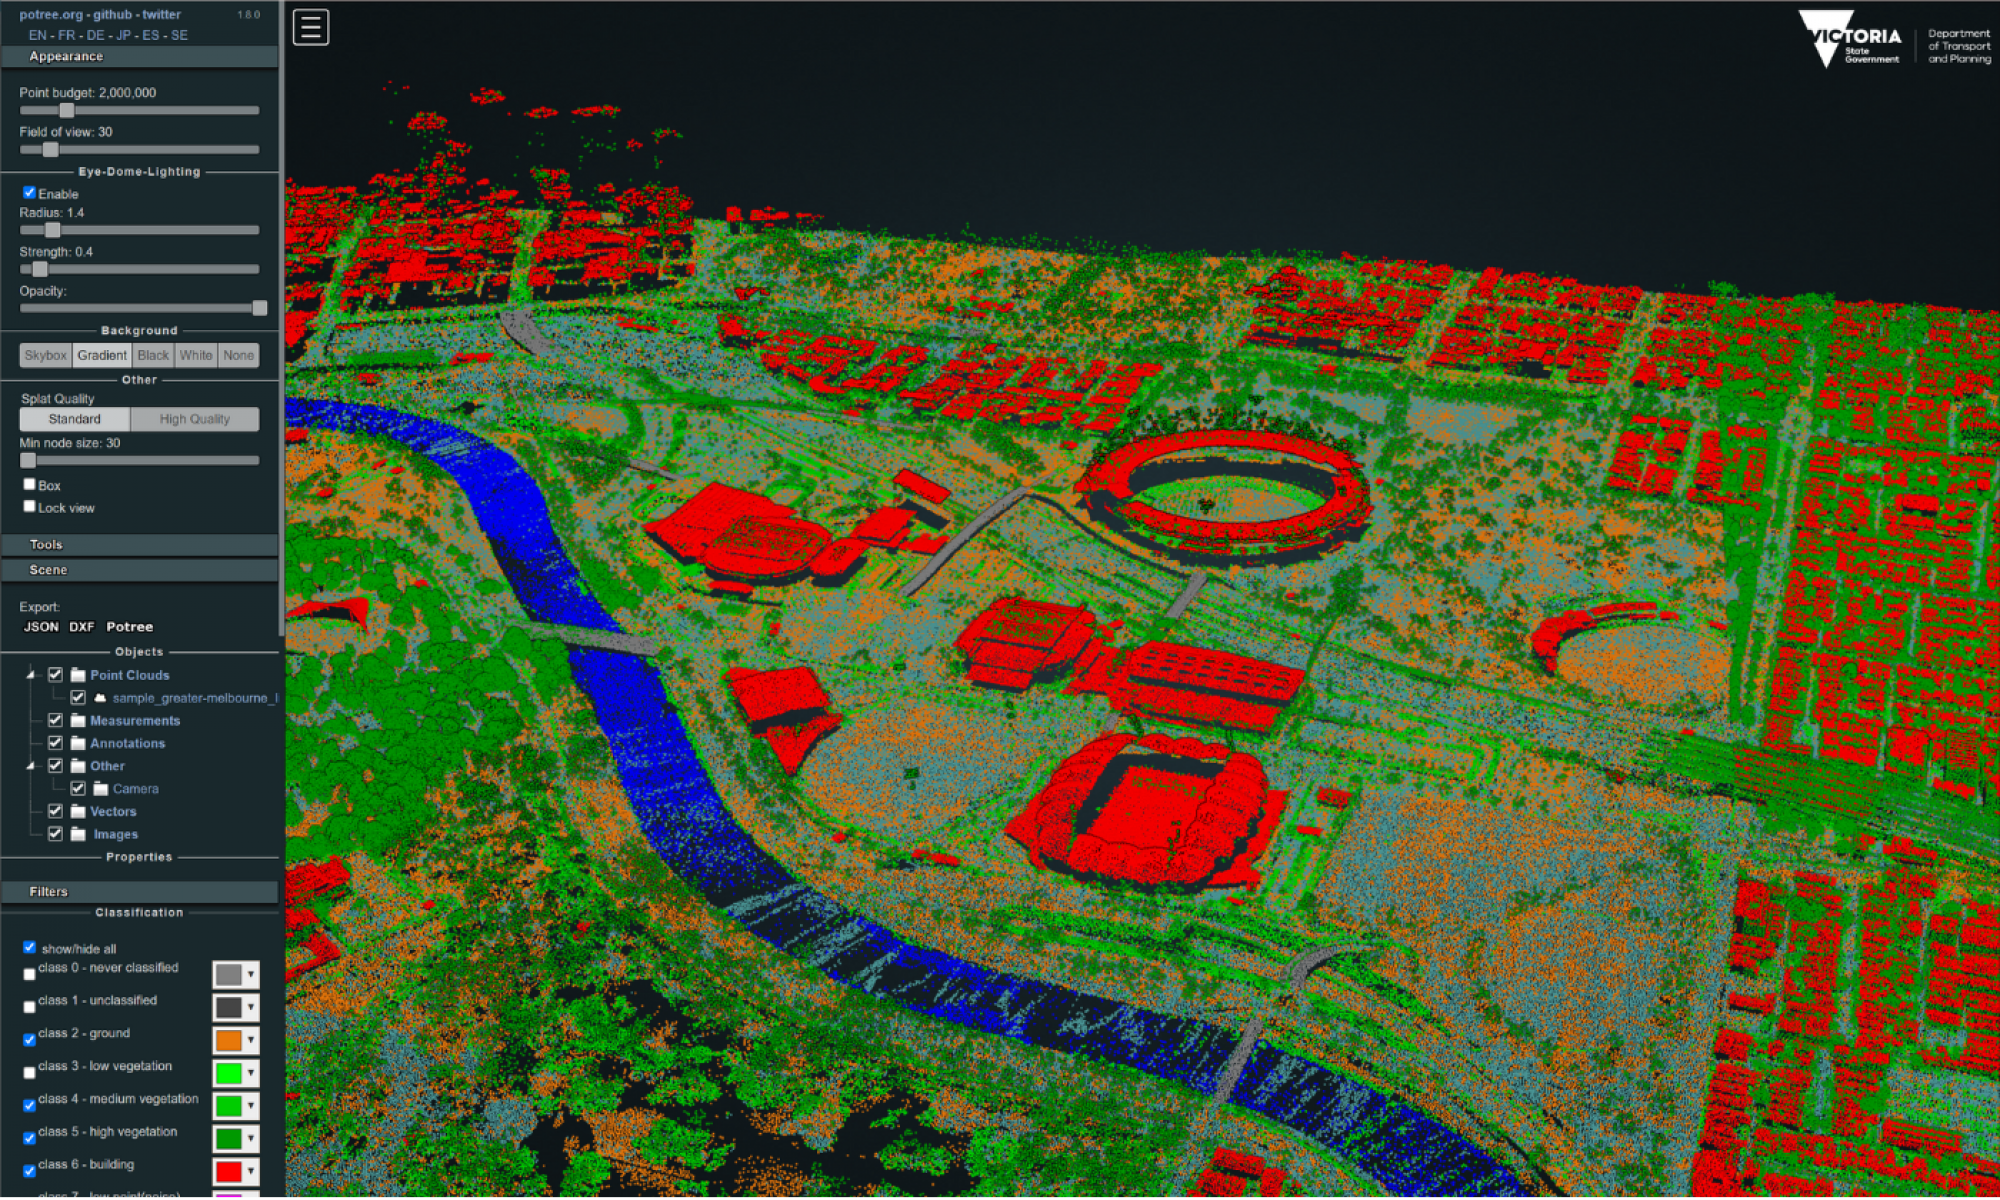
- Point cloud view of East Melbourne, Fitzroy Gardens, MCG and Yarra river symbolised by classification.
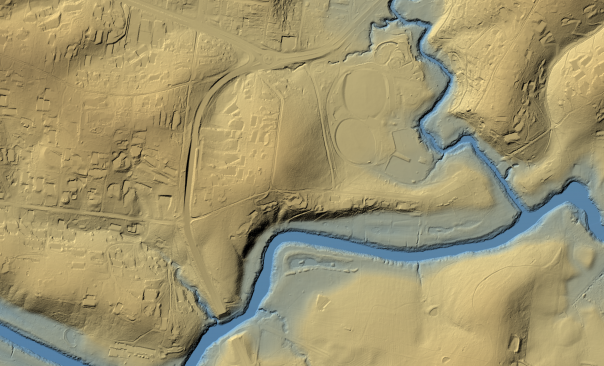
- Hill shaded representation of the 1 m bare earth Melbourne LiDAR Digital Elevation Model (DEM).
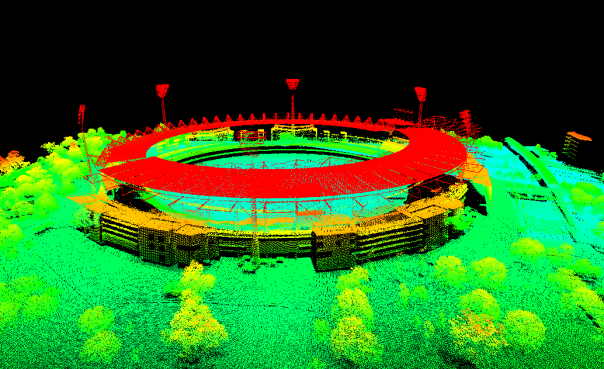
- Point cloud view of the MCG symbolised by classification.

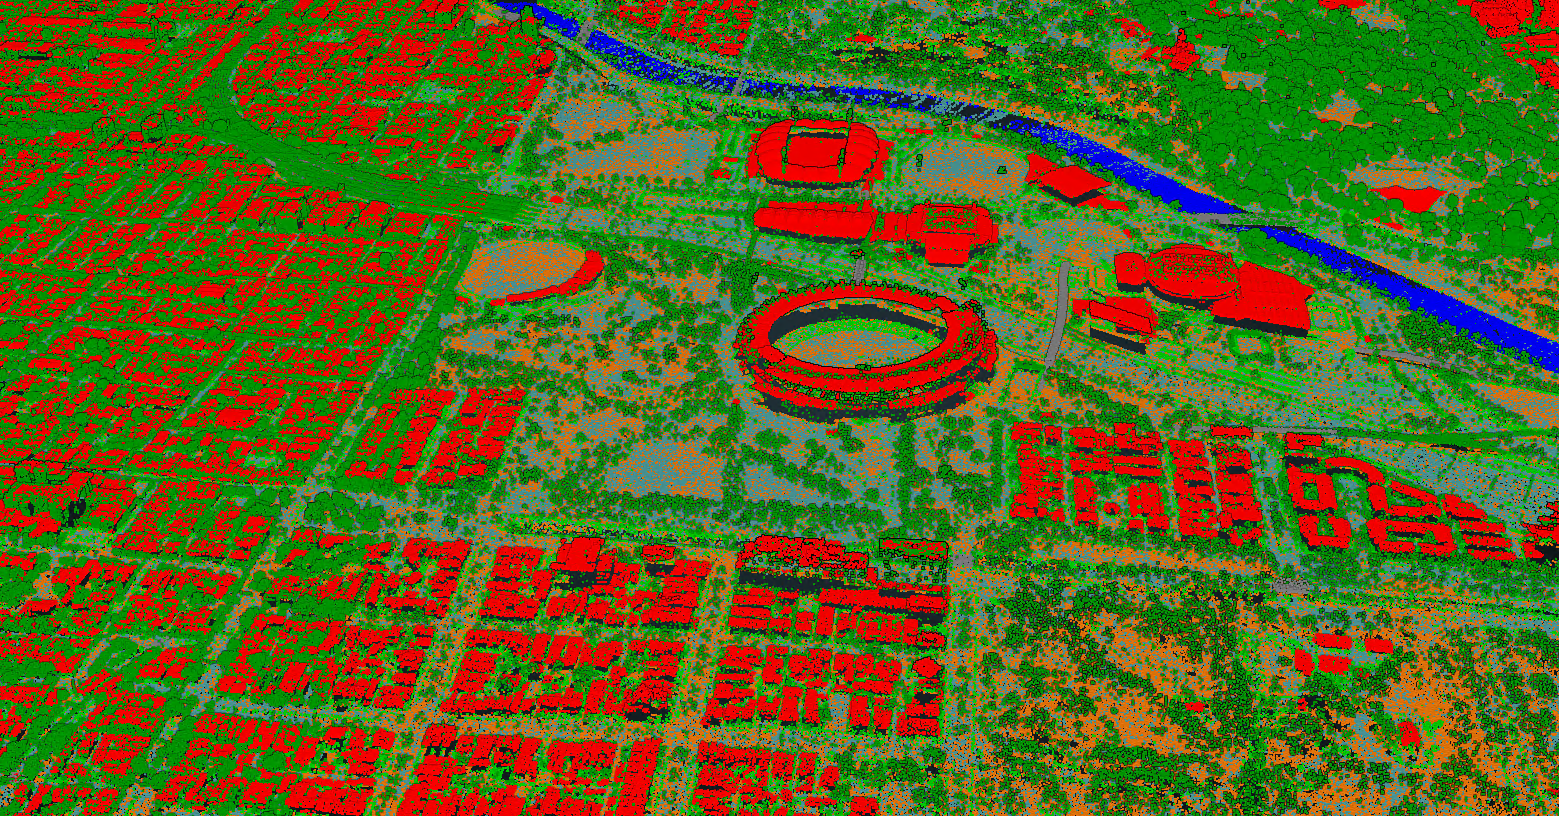
- Point-cloud view of the CBD and Carlton Gardens symbolised by classification.
Point cloud view of East Melbourne, Fitzroy Gardens, MCG and Yarra river symbolised by classification.

Hill shaded representation of the 1 m bare earth Melbourne LiDAR Digital Elevation Model (DEM).
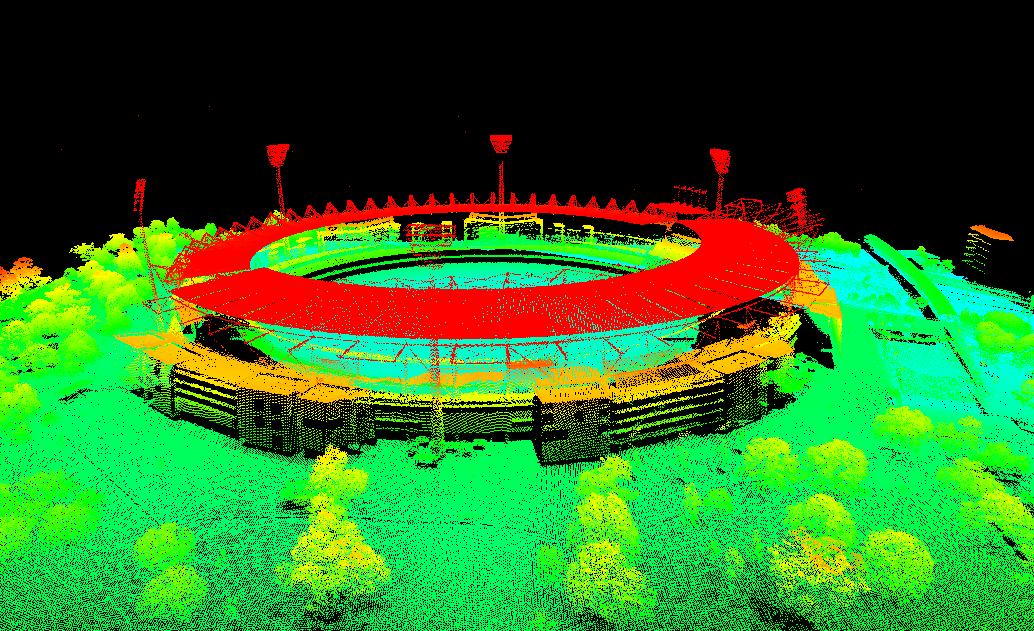
Point cloud view of the MCG symbolised by classification.
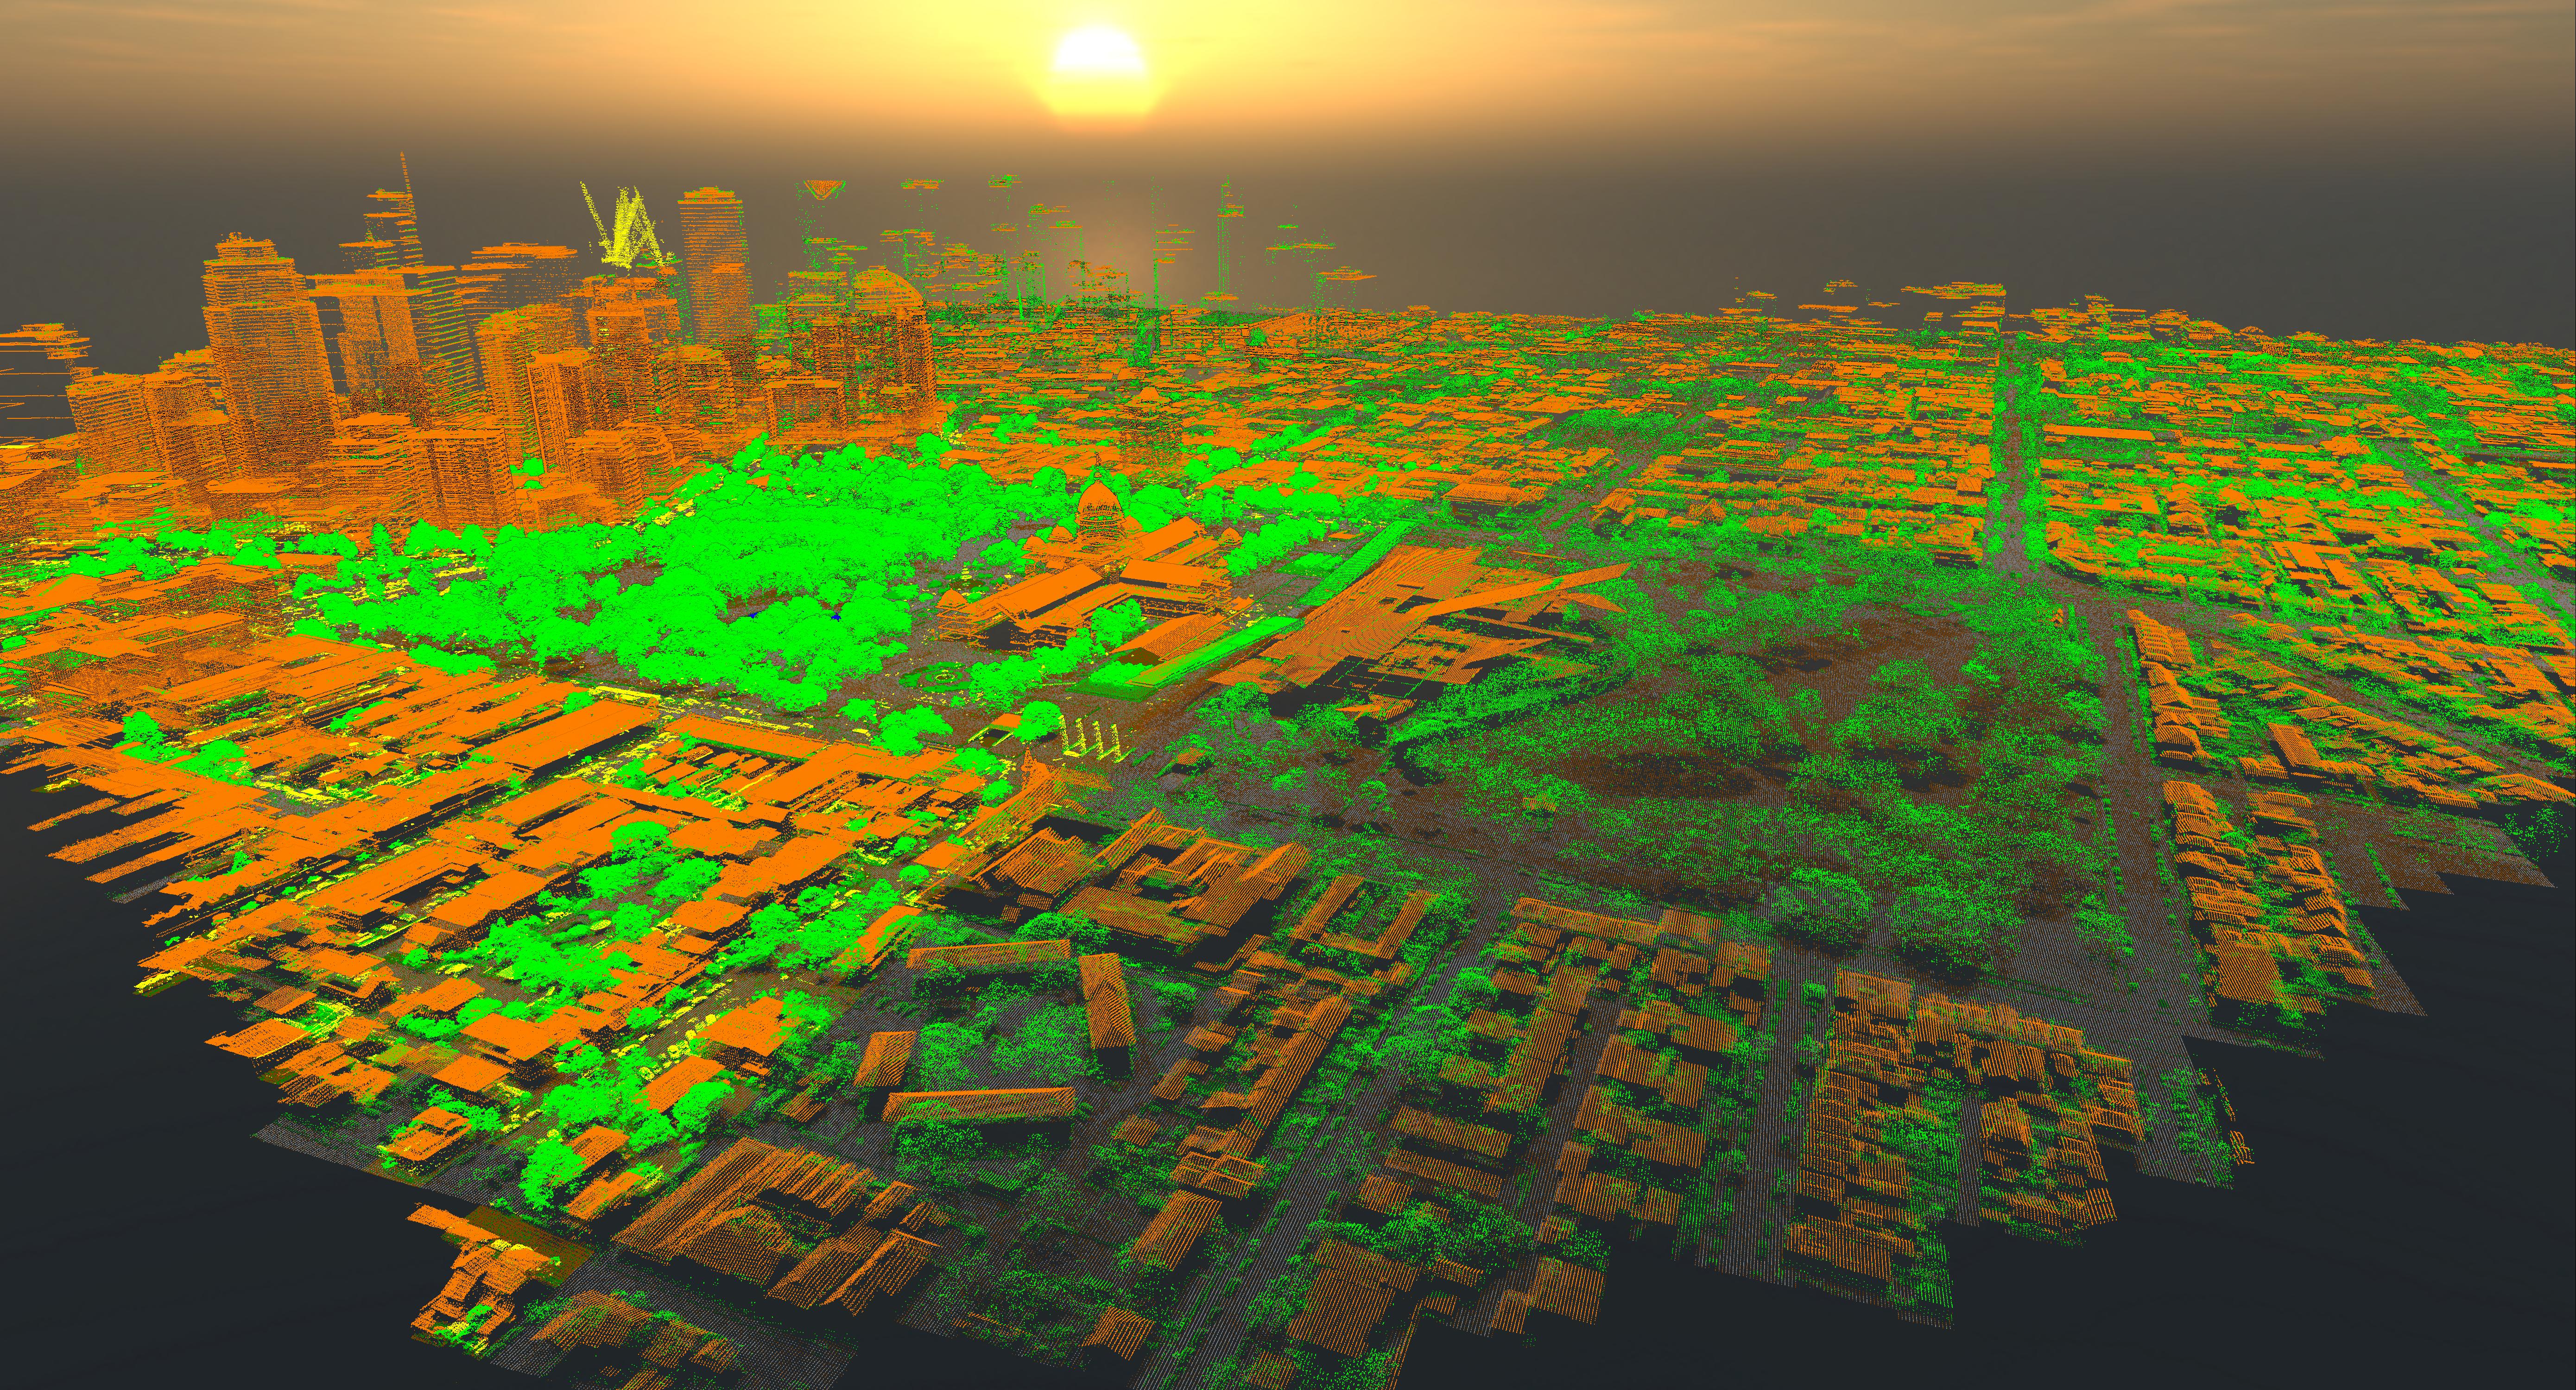
Point-cloud view of the CBD and Carlton Gardens symbolised by classification.
The Greater Melbourne LiDAR project is the largest contiguous LiDAR collection undertaken over Melbourne. The project comprises all of Melbourne’s urban and peri-urban regions, representing the most accurate and consistent depiction of Melbourne’s ground surface, tree cover, and built environment to date.
For quality assurance, the project pioneered the QA4LiDAR software developed by Frontier SI, allowing a range of automated quality checks to ensure consistency throughout the 13,000 km2 extent.
The currency, accuracy and point density of this data continue to support a multitude of land and infrastructure management activities including site investigations, flood mapping, vegetation mapping, surface modelling and land surface change detection.
Extent: 13,000 km2
Point density: 8 pts/m2 (first returns)
Colourised: No
Coordinated reference system: Available in GDA94 & GDA2020, MGA55
Elevation products: LAS 1.2, DEM
Availability: These products are available to license through Vicmap’s Value Added Reseller (VAR) and Data Service Provider (DSP) network for the private sector and via coordinated.imagery@transport.vic.gov.au for government entities.
Partner agencies: Melbourne Water and Coordinated Imagery Program (CIP), Department of Transport and Planning (DTP).
Page last updated: 25/02/25