
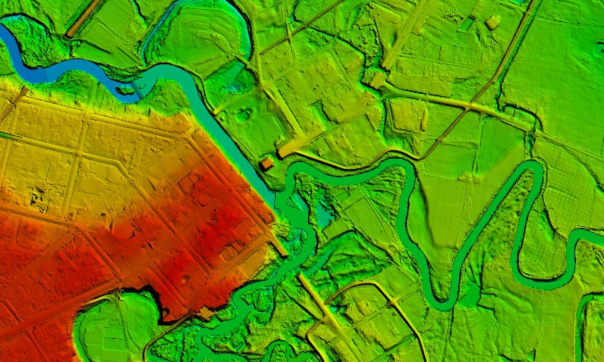
- 1 m Digital Elevation Model (DEM) over Wangaratta.

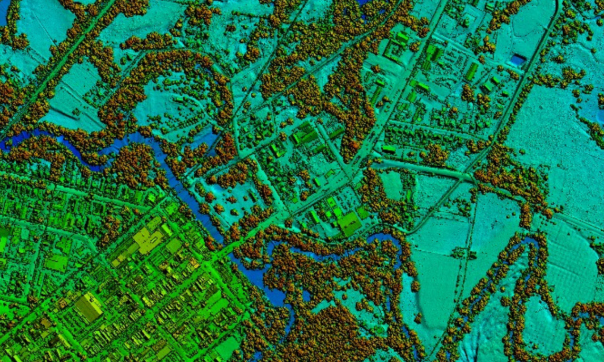
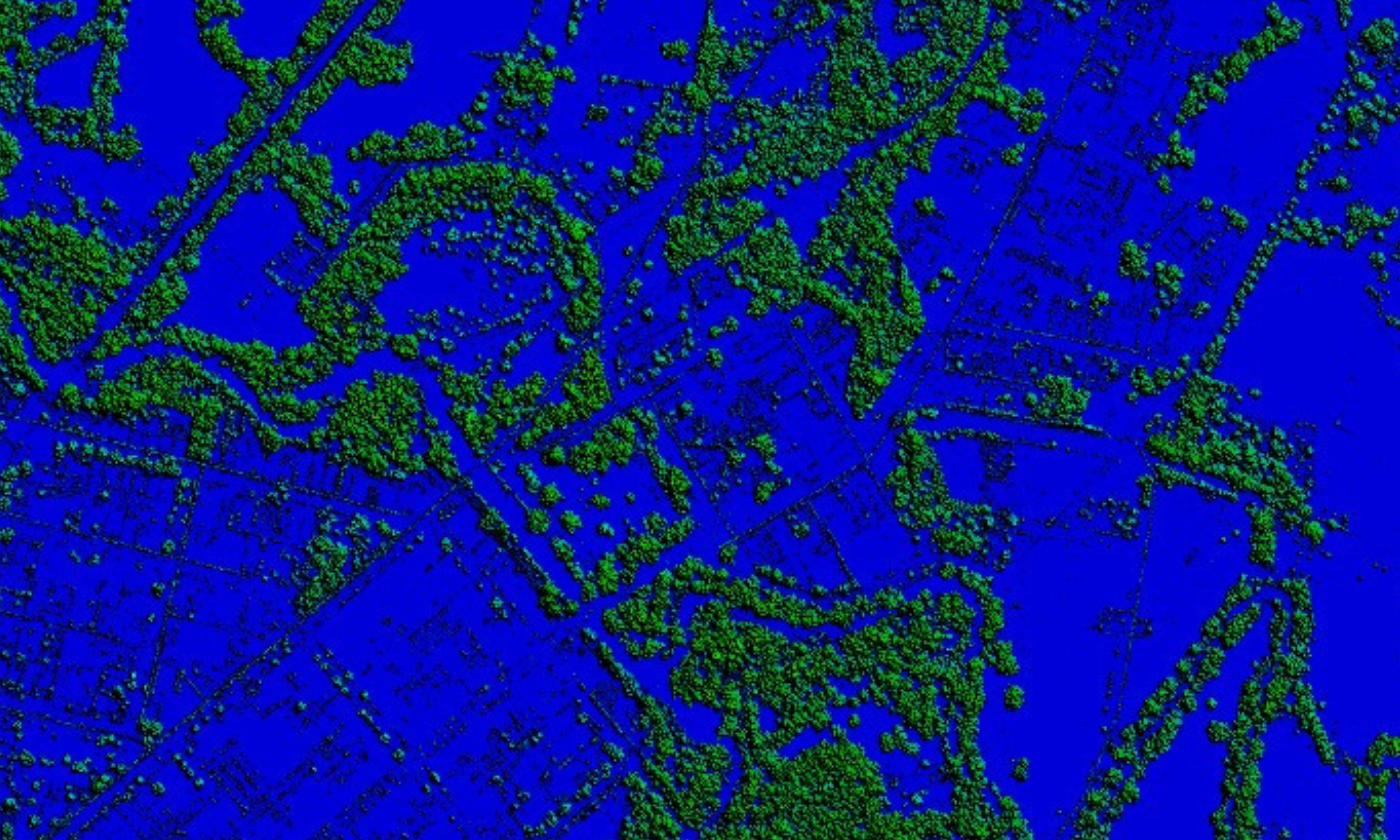
- LiDAR point cloud symbolised by return intensity over Wangaratta.
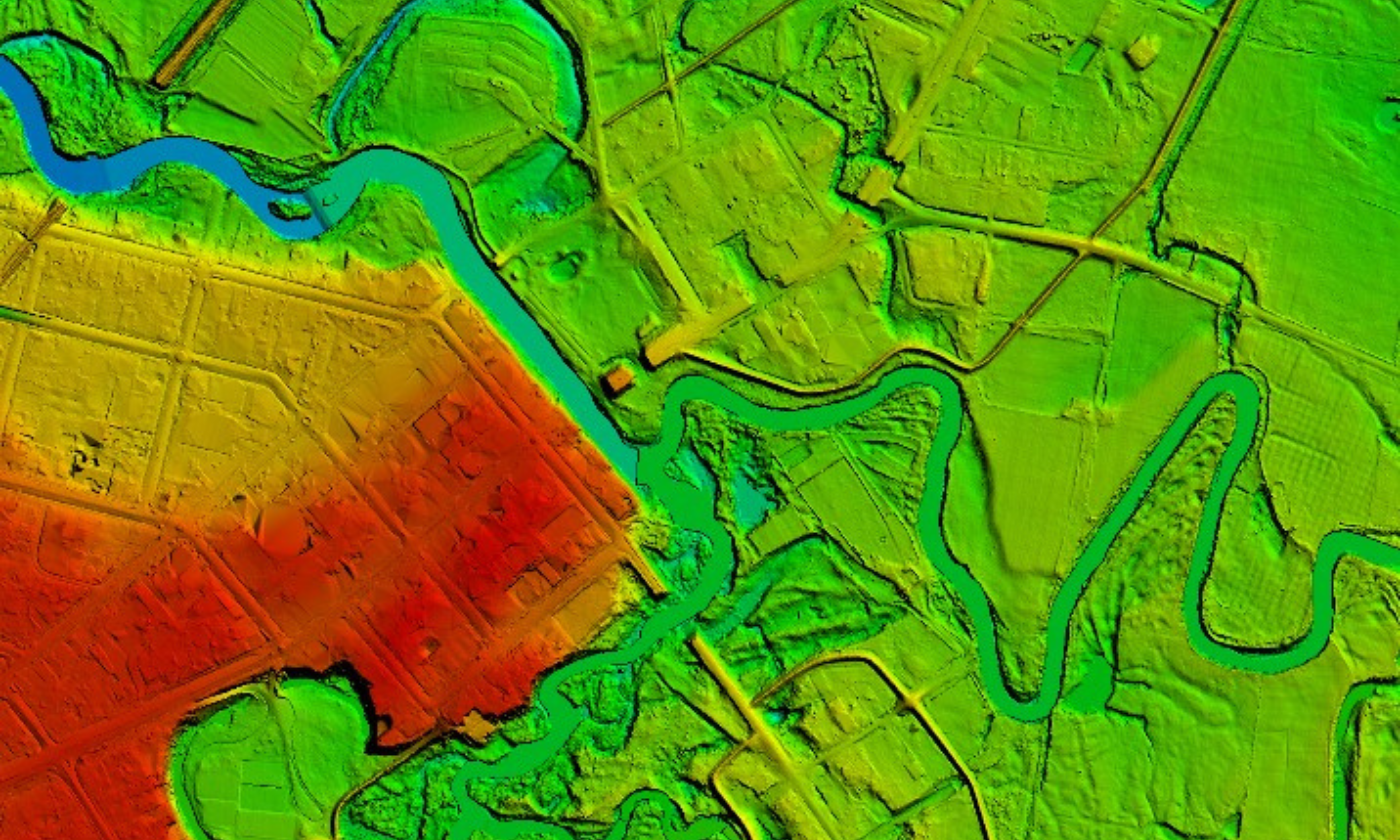
- 1 m Digital Surface Model (DSM) over Wangaratta.

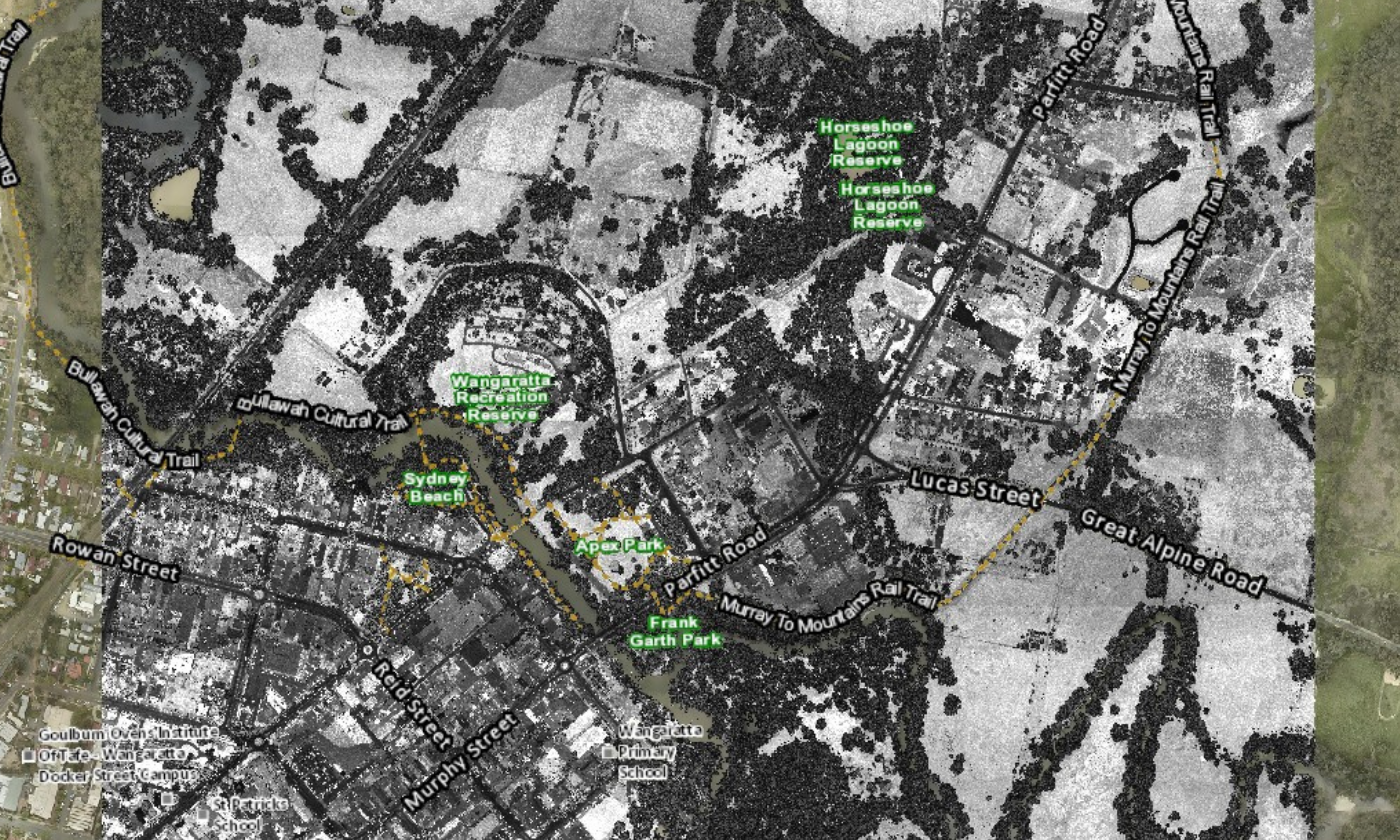
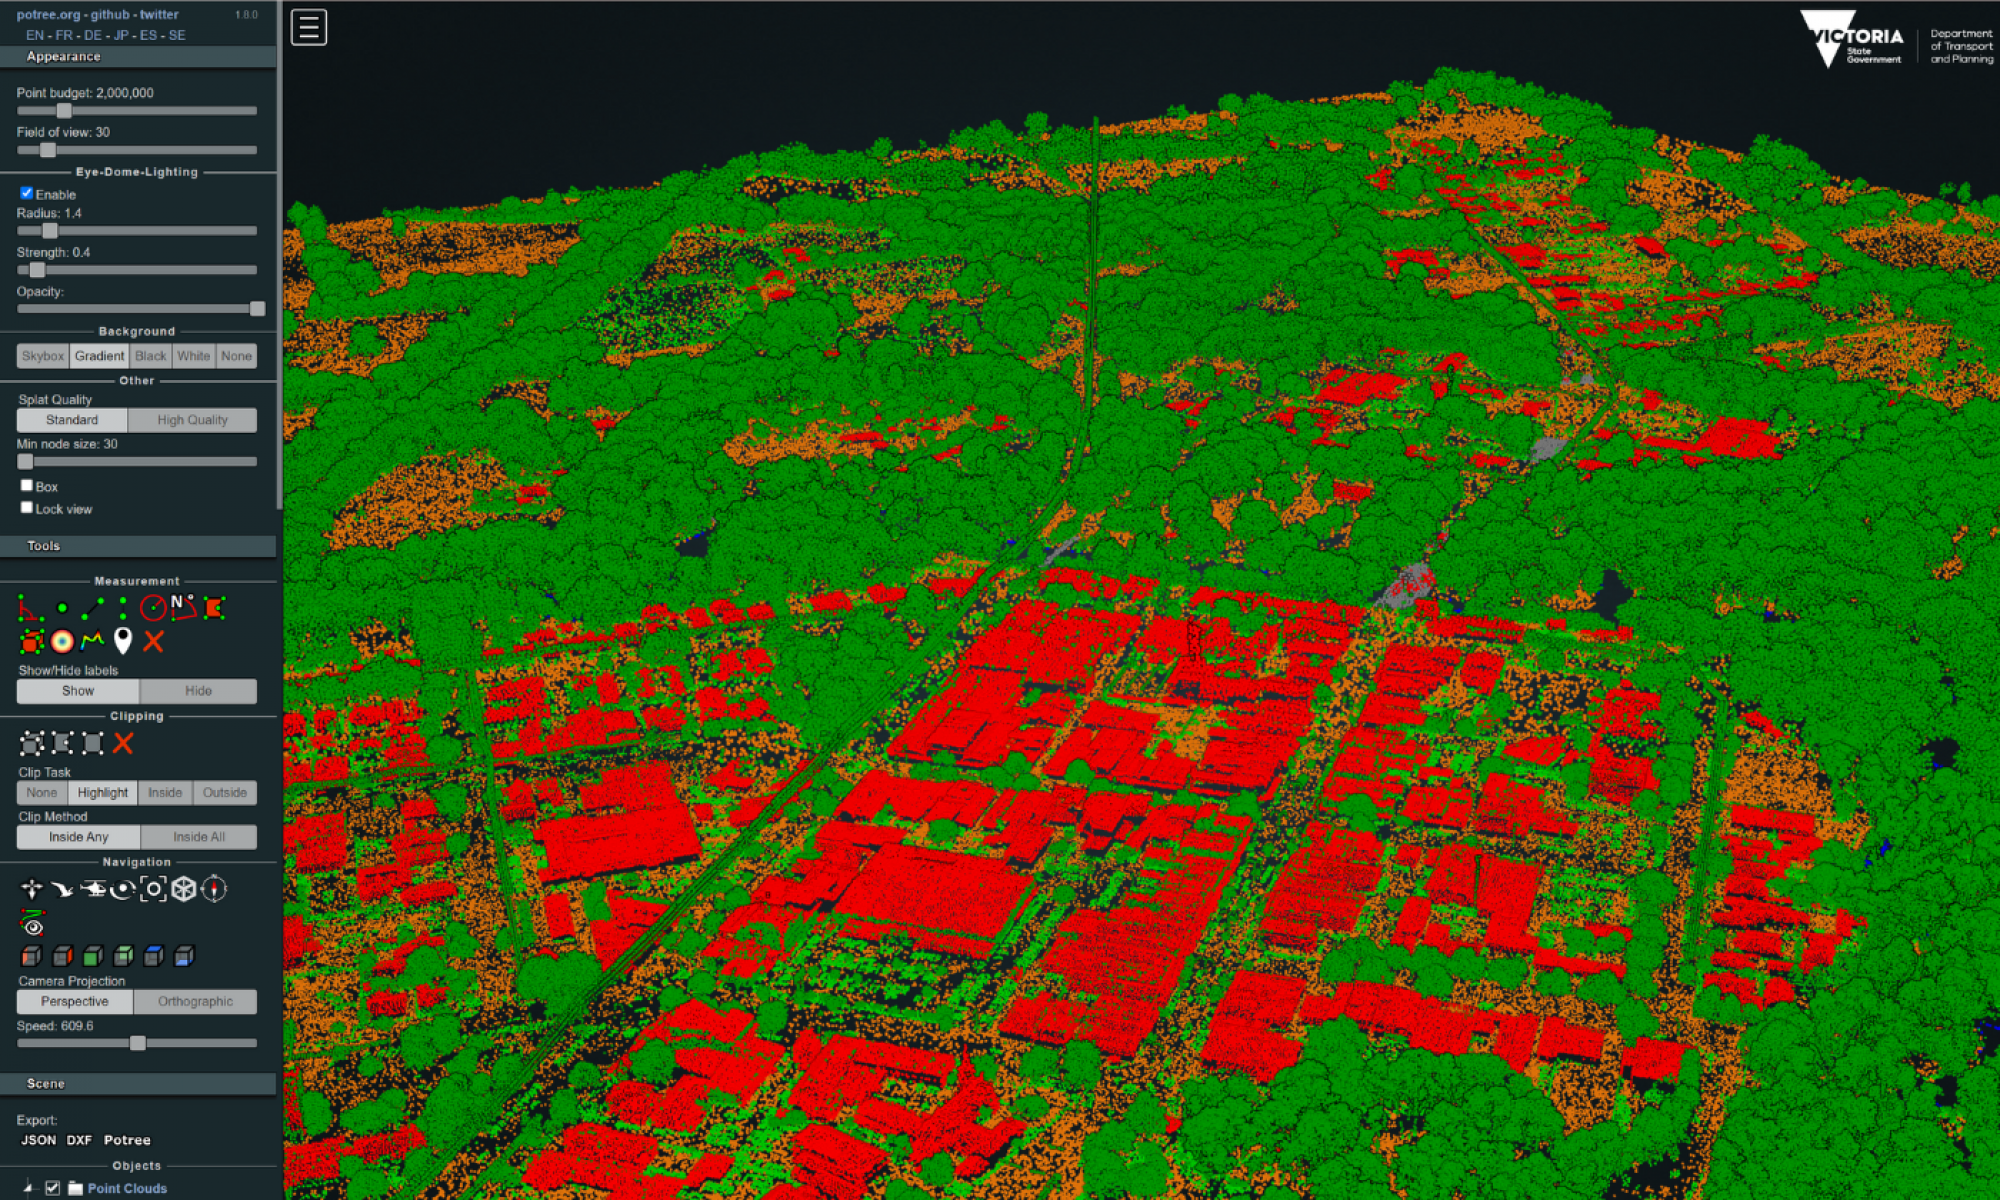
- 1 m Canopy Height Model (CHM) over Wangaratta.
1 m Digital Elevation Model (DEM) over Wangaratta.
LiDAR point cloud symbolised by return intensity over Wangaratta.

1 m Digital Surface Model (DSM) over Wangaratta.
1 m Canopy Height Model (CHM) over Wangaratta.
This project covers 18 Victorian regional townships and includes Ararat, Ballarat, Bendigo, Castlemaine, Echuca, Horsham, Kilmore, Latrobe Valley Corridor (Drouin, Warragul, Trafalgar, Moe), Mildura, Sale, Seymour, Shepparton, Swan Hill, Traralgon, Wangaratta, Warracknabeal and Wonthaggi.
This project investigated the feasibility of extending the state's Vicmap datasets into 3D and 4D. The LiDAR captured in this project supported the generation of 3D photo mesh and building object models for a subset of the 18 townships. Complete LiDAR, Digital Elevation Models (DEM), imagery and 3D models are open data and available through the links below.
3D Models, imagery (ECW/JPG) and DEM (Esri Ascii) can be accessed via this form.
3D Models and photo mesh can be accessed via this form.
Extent: 18 sites, 2,971 km2
Point density: 18 pts/m2 (first returns)
Colourised: RGB
Coordinate reference system: GDA2020, MGA 54 & 55, EPSG 7854 & 7855
Elevation products and resolution: LAS 1.4, DEM 1 m, DSM 1 m, CHM 1 m, BHM 1 m
Availability: Open via Geoscience Australia ELVIS
Partner agencies: Coordinated Imagery Program (CIP), Department of Transport and Planning (DTP).
View elevation glossary.
Page last updated: 12/10/23