
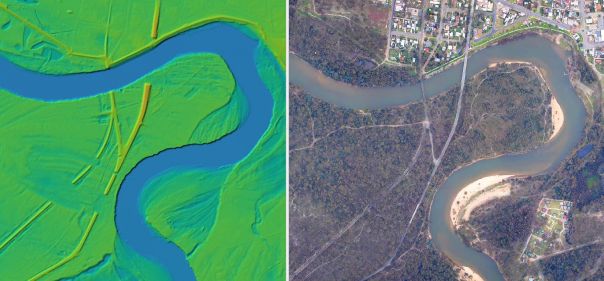
- Comparison between aerial imagery and LiDAR 1 m DEM with bridges removed for hydrology purposes.

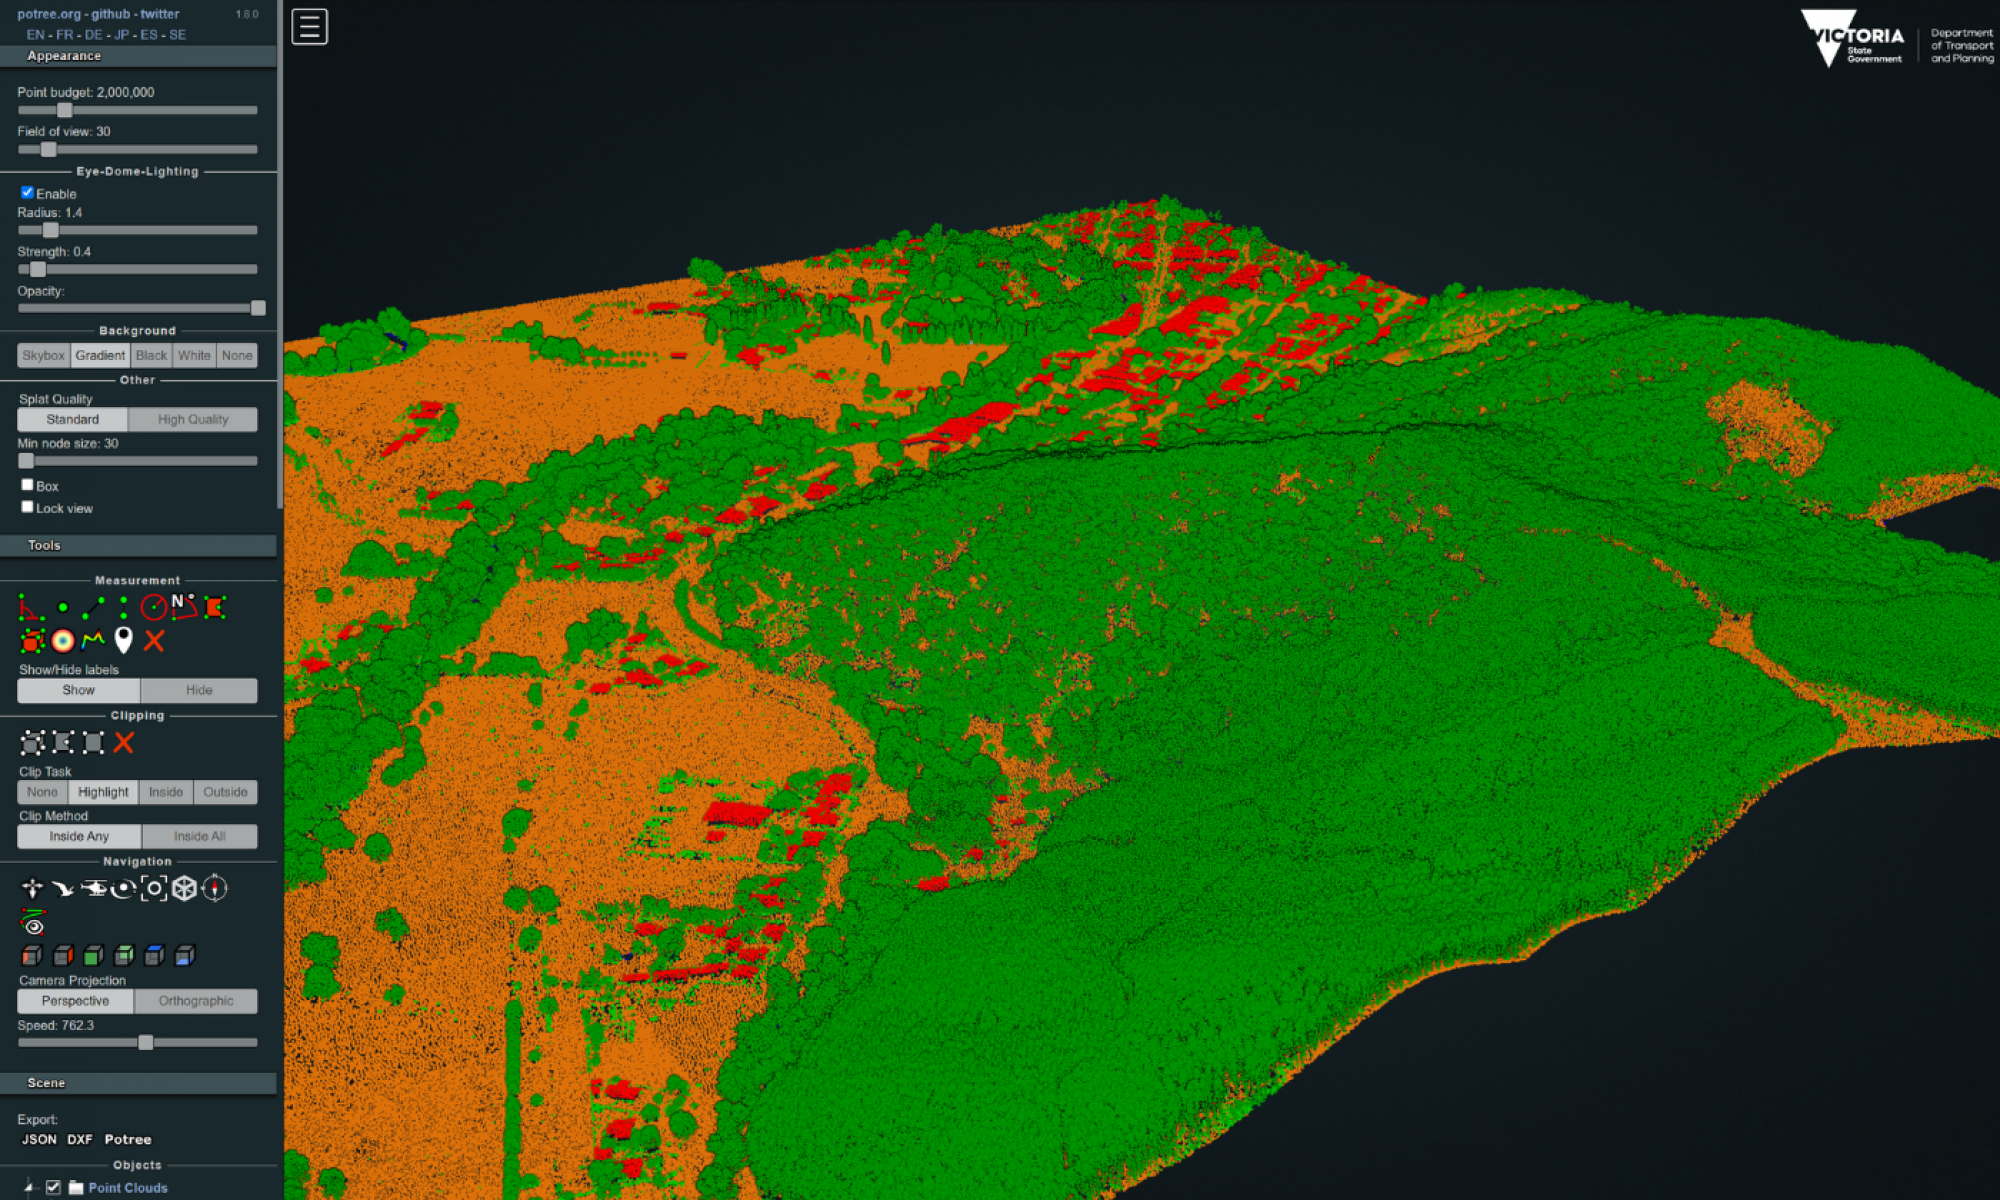
- LiDAR composite view of Myrtleford (imagery and classified point-cloud).
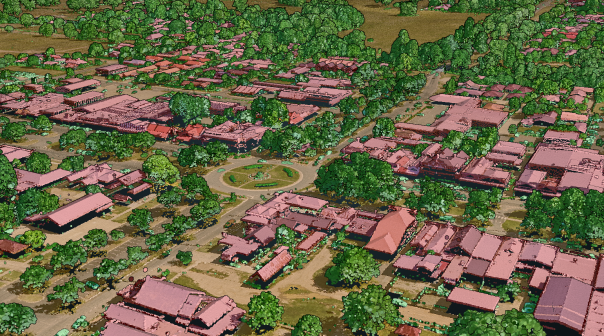
- LiDAR composite view of Mansfield (imagery and classified point-cloud).
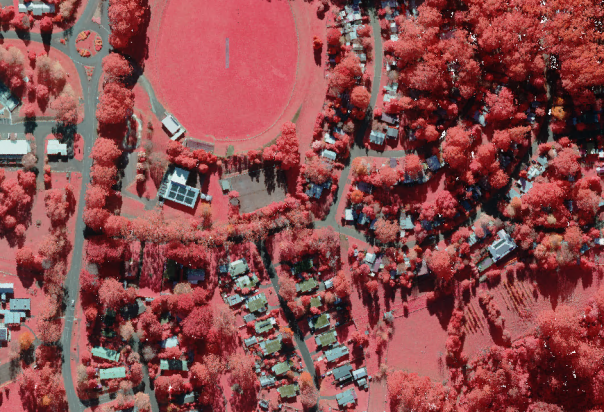
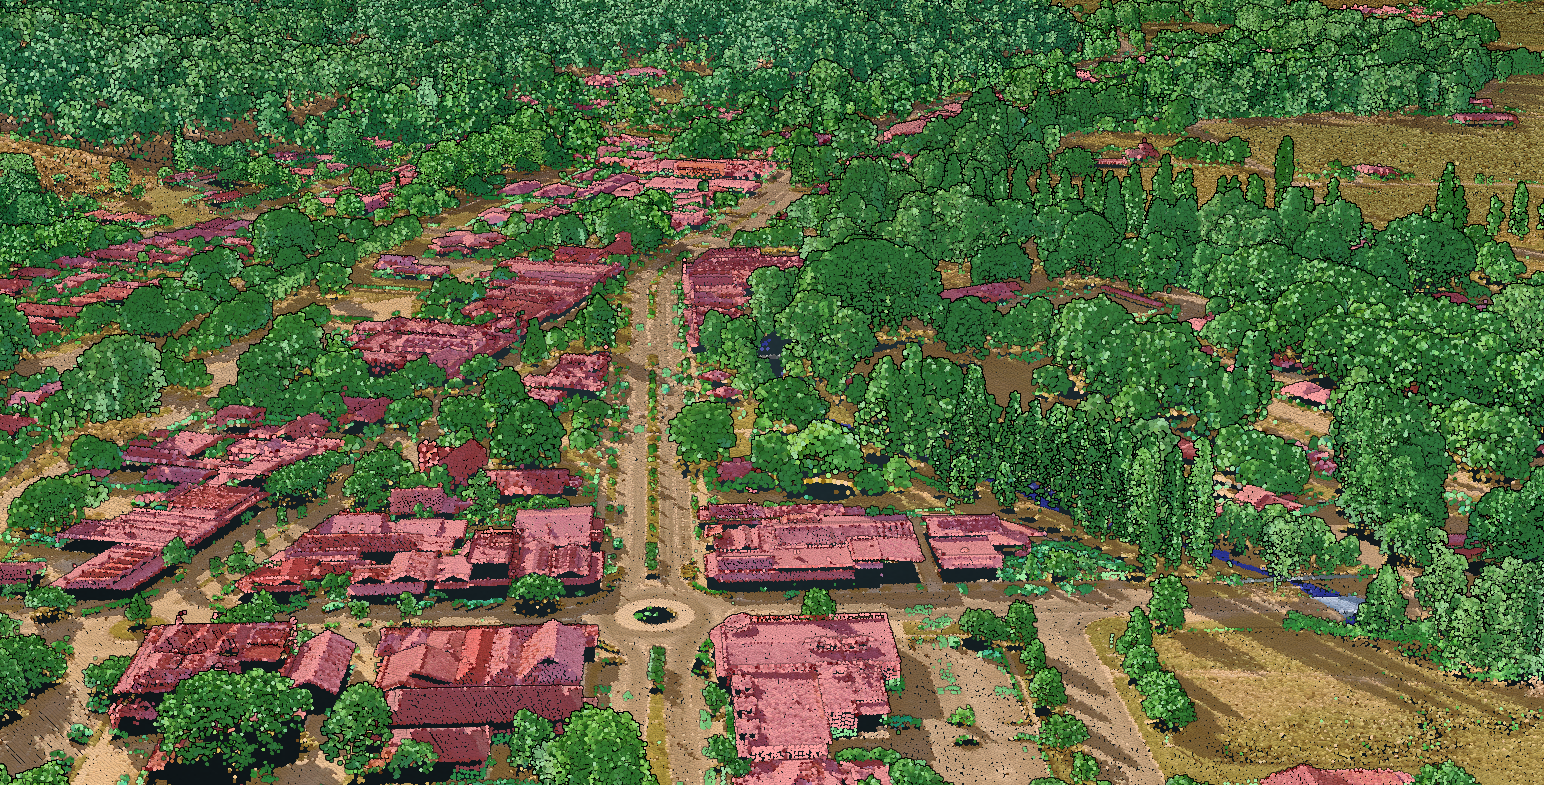
- Point-cloud colourised with colour infrared aerial imagery.

- Visualisation of the Murray River using 1 m DEM with hillshade and false colours.
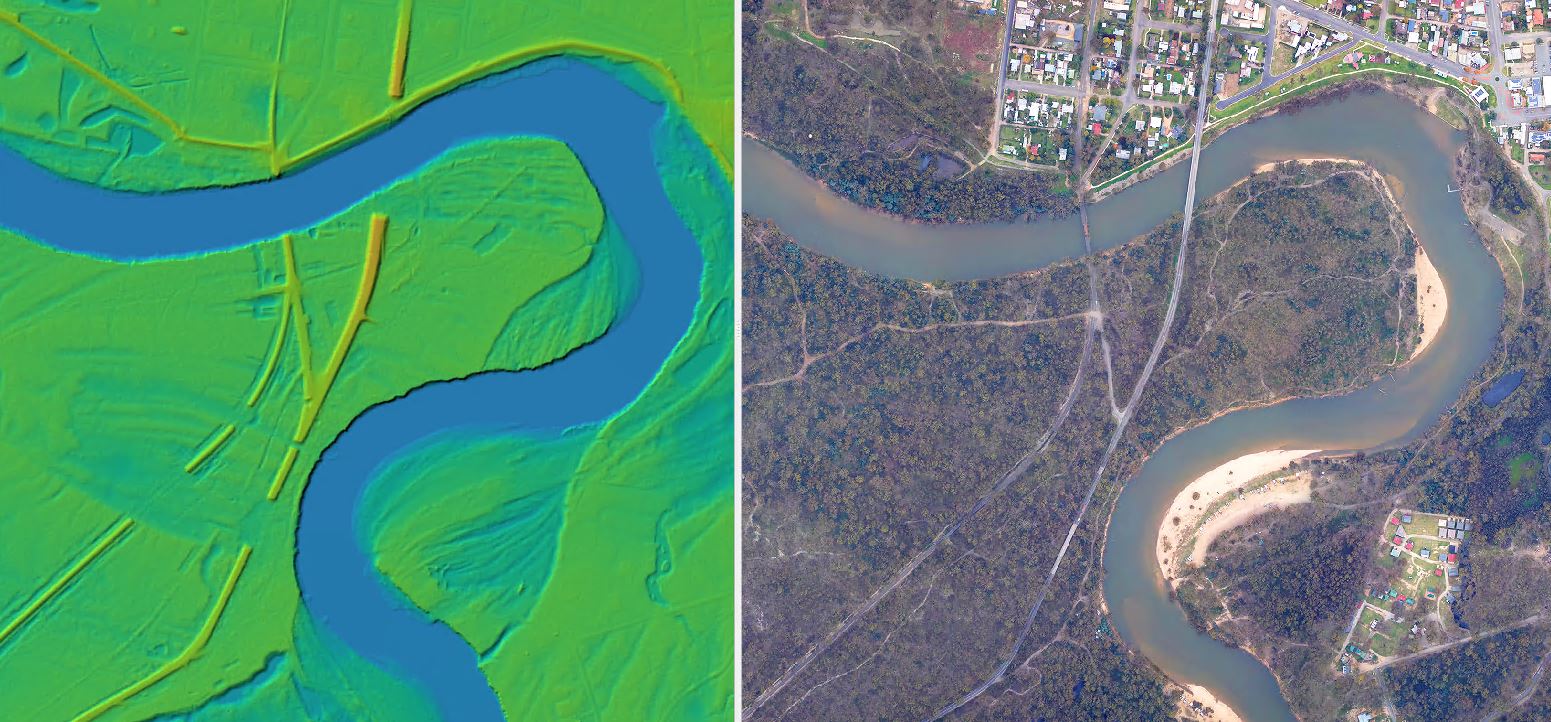
Comparison between aerial imagery and LiDAR 1 m DEM with bridges removed for hydrology purposes.
LiDAR composite view of Myrtleford (imagery and classified point-cloud).

LiDAR composite view of Mansfield (imagery and classified point-cloud).

Point-cloud colourised with colour infrared aerial imagery.
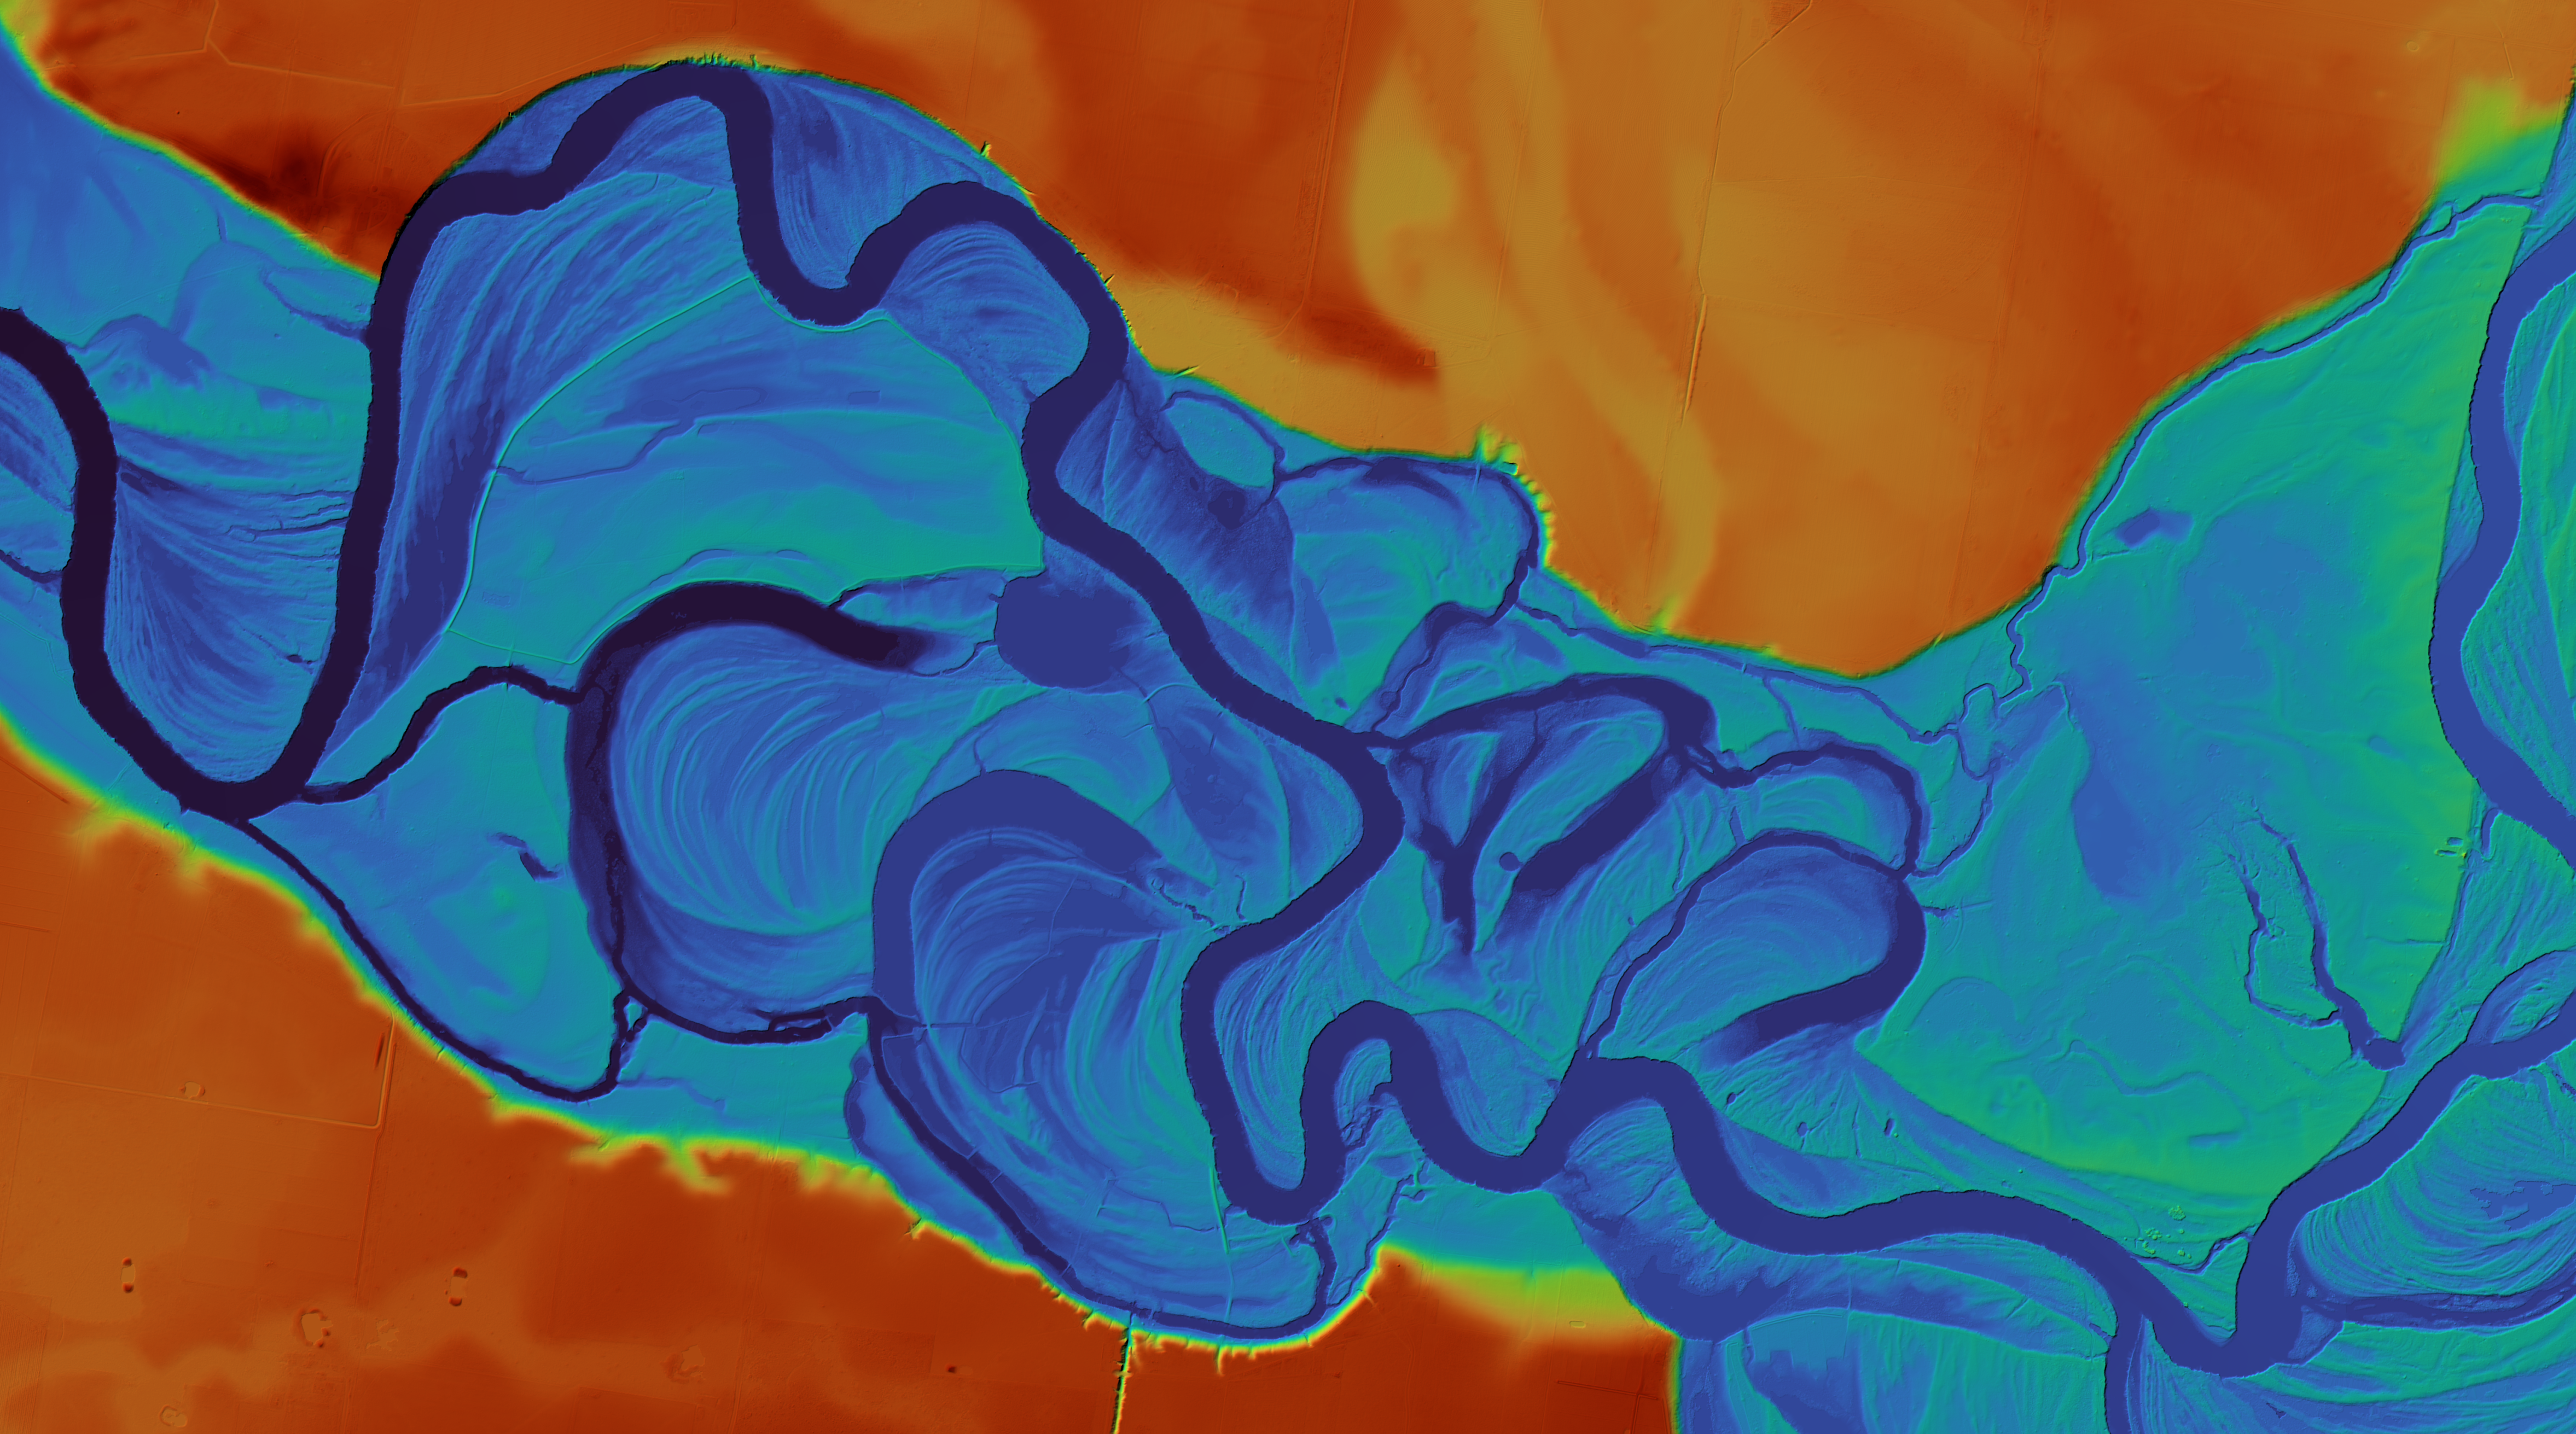
Visualisation of the Murray River using 1 m DEM with hillshade and false colours.
Starting in 2021 and conducted over three years, the Digital Twin Victoria (DTV) LiDAR project is the largest LiDAR survey undertaken in the state’s history. The DTV LiDAR project was primarily conducted to improve the quality and extent of terrain surface data available for Victoria but continues to be used to support an increasing range of use cases.
The project expands on existing LiDAR coverage to represent 99% of Victoria’s population and over 95% of buildings in the state by high accuracy terrain and point cloud data. On completion, the project will have added nearly 60,000 km2 of new LiDAR data.
Extent: >60,000 km2
Point density: Ranging between 8 and 16 points/m2 (first returns)
Colourised: RGB or RGBI
Coordinate reference system: GDA2020 MGA 54/55, AHD
Point cloud: LAZ 1.4, ICSM level 2
Elevation products and resolution: DEM 1 m, DHM 1 m, DSM 1 m
Vertical accuracy: 10 cm (RMSE)
Availability: These products are available to license through Vicmap’s Value Added Reseller (VAR) and Data Service Provider (DSP) network for the private sector and via coordinated.imagery@transport.vic.gov.au for government entities.
Partner Agencies: Digital Twin Victoria (DTV) and the Coordinated Imagery Program (CIP), Department of Transport and Planning (DTP).
Page last updated: 25/02/25